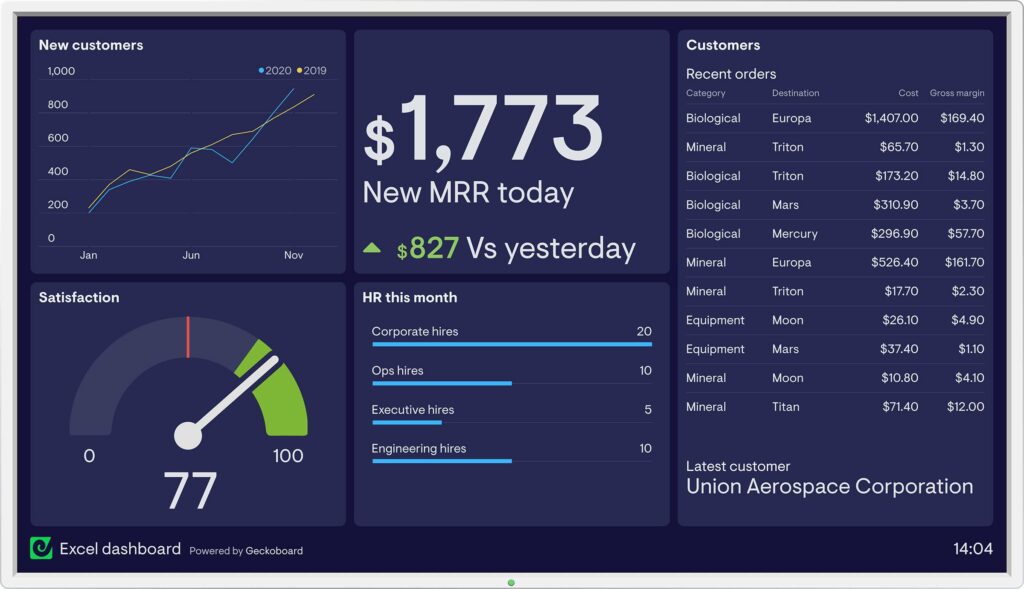
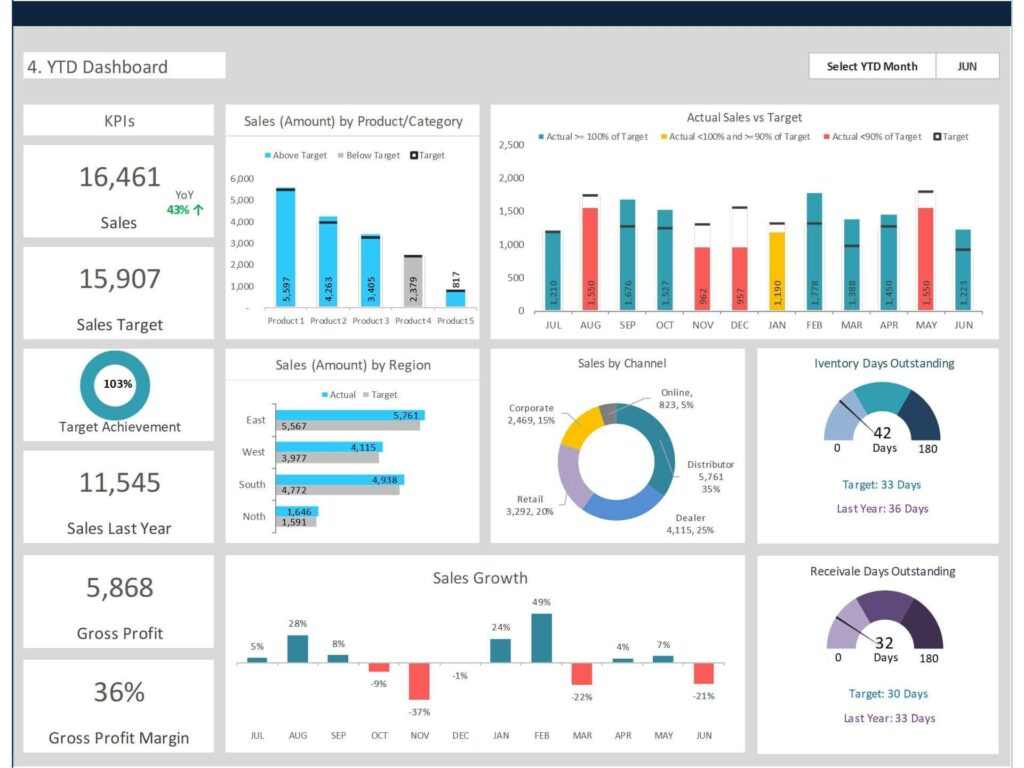
In the realm of data analysis and visualization, Excel Dashboards stand out as powerful tools that transform raw data into actionable insights. Whether you’re a seasoned data analyst or a novice Excel user, understanding how to create effective dashboards can revolutionize the way you interpret and utilize data. Join us on a journey as we explore the ins and outs of Excel Dashboard Examples and unlock the secrets to maximizing their potential.
What Are Excel Dashboards?
Excel Dashboards are dynamic tools that provide a visual representation of data trends, patterns, and metrics. They offer a centralized platform where users can monitor key performance indicators (KPIs), track progress, and gain valuable insights at a glance. From sales performance metrics to project management dashboards, Excel offers endless possibilities for customizing dashboards to suit your specific needs.
Why Excel Dashboards Matter
In today’s data-driven world, the ability to quickly and effectively analyze data is crucial for making informed decisions. Excel Dashboards empower users to condense vast amounts of information into digestible visuals, enabling faster decision-making and strategic planning. Whether you’re presenting findings to stakeholders or conducting internal analysis, Excel Dashboards streamline the data visualization process and enhance communication.
Excel Dashboard Examples: Practical Applications
- Sales Performance Dashboard: Track sales revenue, conversion rates, and customer acquisition metrics in real-time. Visualize sales trends over time, identify top-performing products or regions, and spot potential areas for improvement.
- Project Management Dashboard: Monitor project progress, deadlines, and resource allocation with a comprehensive project management dashboard. Track task dependencies, budget utilization, and team performance to ensure projects stay on track and within budget.
- Financial Dashboard: Keep a close eye on financial health and performance metrics with a customized financial dashboard. Visualize cash flow, expenses, and profitability ratios to make informed financial decisions and drive business growth.
- Marketing Campaign Dashboard: Measure the effectiveness of marketing campaigns and track key marketing metrics such as website traffic, conversion rates, and social media engagement. Identify successful campaigns, optimize marketing strategies, and allocate resources more effectively.

Tips for Creating Effective Excel Dashboards
- Define Your Objectives: Before diving into dashboard creation, clearly define the objectives and key metrics you want to track. Understanding your goals will guide the design process and ensure your dashboard delivers actionable insights.
- Keep It Simple: Avoid cluttering your dashboard with unnecessary elements or overly complex visuals. Opt for clean, intuitive design layouts that prioritize clarity and ease of interpretation.
- Use Interactive Elements: Leverage Excel’s interactive features such as slicers, filters, and pivot tables to enhance user experience and facilitate data exploration.
- Regularly Update Data: Ensure your dashboard reflects the most up-to-date information by regularly updating data sources and automating data refreshes where possible.
- Seek Feedback: Solicit feedback from end-users to identify areas for improvement and refine your dashboard design over time. Continuous iteration is key to creating dashboards that truly meet the needs of your audience.
Leveraging Advanced Features
Take your Excel dashboards to the next level by incorporating advanced features and techniques:
- Conditional Formatting: Highlight important data points or trends using conditional formatting to draw attention to key insights.
- Dynamic Charts: Create dynamic charts that automatically adjust based on user inputs or changes in underlying data, providing a more interactive user experience.
- Data Visualization Best Practices: Follow data visualization best practices to ensure your dashboards are visually appealing and effectively communicate insights. Consider factors such as color choice, chart selection, and labeling to maximize clarity and comprehension.
- Integration with Other Tools: Integrate Excel dashboards with other tools and platforms, such as Power BI or Tableau, to leverage additional analytics capabilities and enhance data visualization.
Excel Dashboard Examples in Action
Let’s dive deeper into a practical example to illustrate the power of Excel dashboards in action:
Case Study: Sales Performance Dashboard
Imagine you’re a sales manager responsible for monitoring the performance of your regional sales teams. By creating a Sales Performance Dashboard in Excel, you can track key metrics such as:
- Total Revenue
- Sales Growth
- Conversion Rates
- Top-performing Products or Regions
- Sales Pipeline Analysis
With a well-designed dashboard, you can visualize trends, identify areas for improvement, and make data-driven decisions to drive sales growth. By regularly updating data and leveraging interactive features such as slicers and filters, you can provide your sales team with real-time insights to guide their actions and optimize performance.

Unlock the Potential of Excel Dashboards Today!
Whether you’re a business professional, data analyst, or Excel enthusiast, Excel Dashboard Examples offer a powerful tool for transforming data into actionable insights. By mastering the art of dashboard design and leveraging advanced features, you can unlock the full potential of Excel and drive business success.
Ready to get started? Explore our comprehensive resources, tutorials, and templates to kickstart your journey into the world of Excel dashboards. With creativity, innovation, and a commitment to excellence, you can harness the power of data visualization to make smarter, more informed decisions. Excel Dashboard Examples await – are you ready to take your data analysis to the next level?
